Tracking Setup
Umami Analytics: Cloud Pricing and Self-Hosting Costs
Introduction: Why Umami Analytics Stands Out
Privacy-focused analytics platforms have become a necessity, not a luxury. Google Analytics feels bloated, intrusive, and increasingly risky from a compliance perspective. Website owners want simplicity, speed, and control—and Umami delivers exactly that. Built by three brothers who were frustrated with existing analytics tools, Umami combines open-source transparency with a user-friendly interface that doesn’t require a data scientist to understand.
Privacy gets Umami in the door; what keeps it installed is everything else. It’s the combination of simplicity, speed, affordable pricing, and powerful self-hosting options. Whether you run a small blog or manage analytics for enterprise clients, Umami scales to your needs. This guide covers everything: setup, features, the official Umami Cloud pricing (including what the free plan really covers), real-world workflows, and how it compares to alternatives like Plausible and Google Analytics.
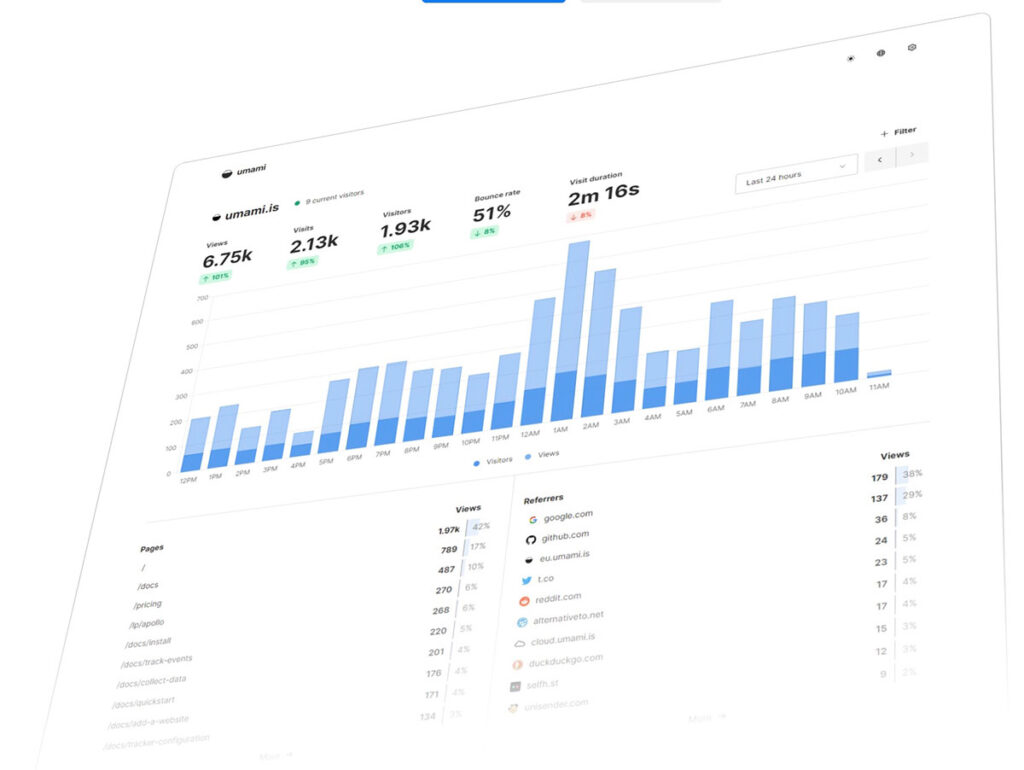
Understanding Umami: The Core Philosophy
Umami is built on a fundamental principle: analytics should be simple, fast, and respect privacy. The fully open source code is available on GitHub. Unlike Google Analytics, which treats analytics as a vehicle for data collection and advertising, Umami treats it as a tool for website improvement.
Core Values:
- No personal data collection – Only aggregated, anonymized metrics
- No cookies required – Visitors don’t need consent banners
- GDPR/CCPA compliant – Built for privacy laws from the start
- Fully open source – Code is transparent and community-reviewed
- Self-hostable – Full control over your data
- Blazingly fast – Lightweight script, quick dashboard loads
The claim survives measurement. Every design decision reflects these values. The tracking script is minuscule. The dashboard loads instantly. Privacy is baked into every feature, not added as an afterthought.
Key Features That Matter
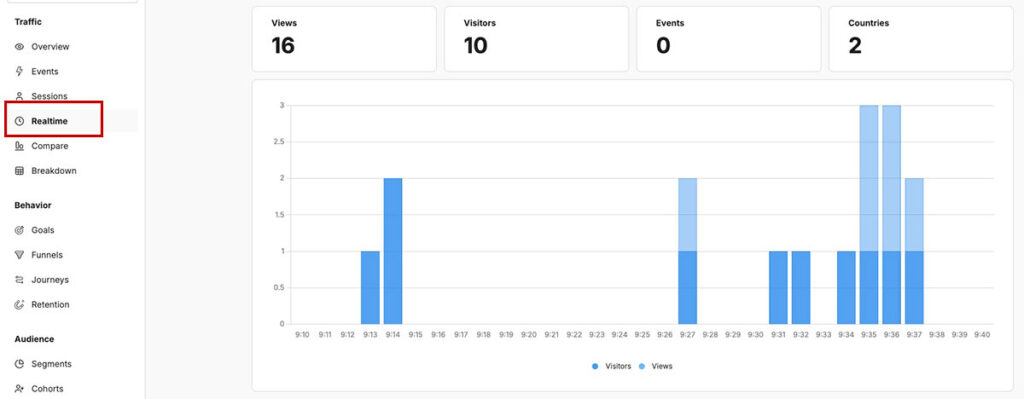
Real-Time Dashboard
The moment you add the tracking script, Umami begins collecting data. The dashboard displays:
- Visitors: Unique individuals visiting your site
- Visits: Total visits (same person visiting multiple times counts separately)
- Pageviews: Total pages viewed
- Visit Duration: Average time spent per session
All stats update in real-time (with ~1-2 second delay). You can see live activity as it happens, watch traffic spikes occur, and monitor feature launches in real-time.
Flexible Date Range Selection
By default, Umami shows the last 28 days. But you can easily switch to:
- Today
- Last 24 hours
- This week / Last week
- This month / Last month
- 90 days
- Custom date range
When you change the date range, all data refreshes automatically. This makes it trivial to compare periods, analyze campaign performance, or spot trends.
Detailed Traffic Breakdown
Navigate to the Details page to see:
- Pages: Which pages drive traffic, bounce rate per page, average visit duration
- Referrers: Which sites send visitors to you (search engines, directories, blogs)
- Devices: Desktop vs. mobile breakdown, device types
- Countries: Geographic distribution of visitors
- Browsers: Chrome, Safari, Firefox usage
- OS: Windows, macOS, iOS, Linux breakdown
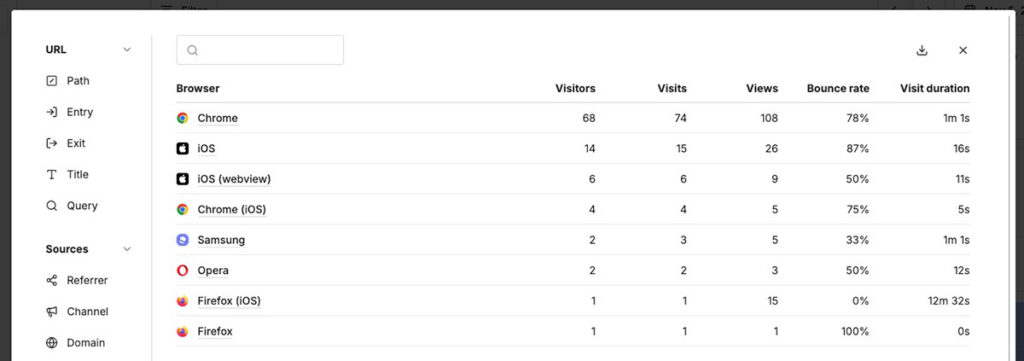
Each section can be filtered independently. Want to see only mobile traffic from the US visiting your blog? Filter “Mobile” + “United States” + “/blog/*” and you’re done.
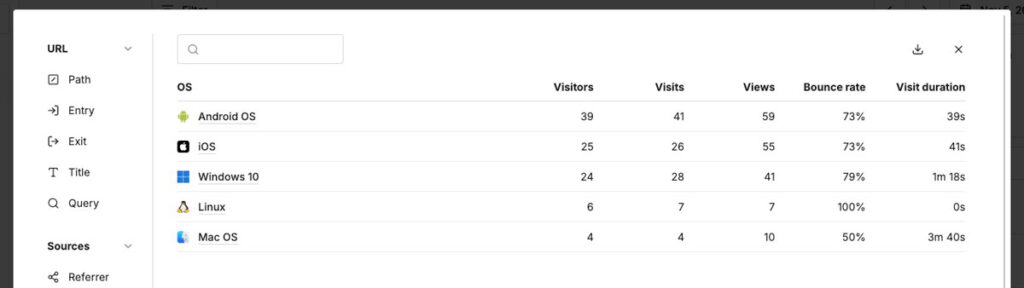
Custom Events and Goal Tracking
This is where Umami transforms from “basic analytics” to “actionable product intelligence.” For a complete list of ways to track events, please refer to official documentation for tracking events.
Adding Custom Events
Track any action that matters to your business:
xml<!-- Add data attributes to HTML elements -->
<button data-umami-event="Signup clicked">Sign Up</button>

<link data-umami-event="Download PDF" href="/files/guide.pdf">Download</link>

<a data-umami-event="Outbound link" href="https://example.com">Visit</a>
Or use JavaScript directly:
javascriptumami.track('purchase', { value: 99, currency: 'USD' });
umami.track('video_play', { video_id: '12345' });
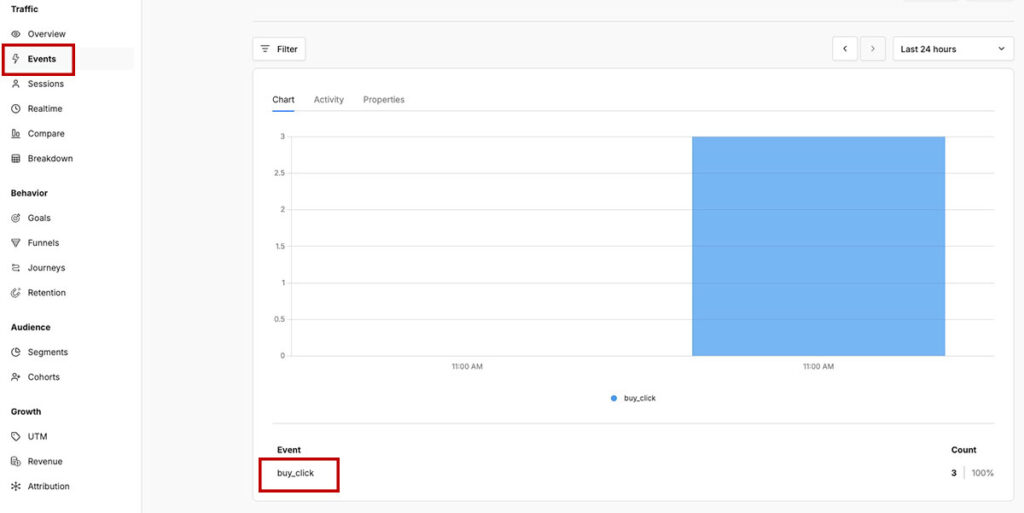
Events appear in the Events section of your dashboard with full filtering and segmentation.
Setting Up Goals
Goals are milestones you want to track. Examples:
| Site Type | Goal Examples |
|---|---|
| SaaS | Free trial signup, payment, API usage |
| E-commerce | Add to cart, checkout, purchase |
| Blog | Newsletter signup, comment posted |
| Course Platform | Enrollment, lesson completion, quiz |
| Content Site | Read time > 3 min, download, share |
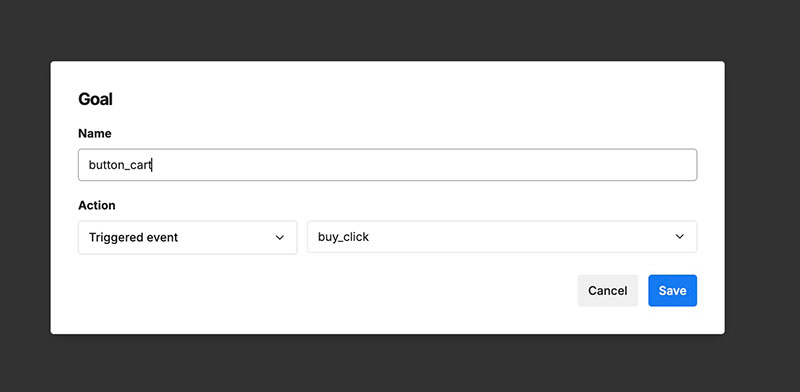
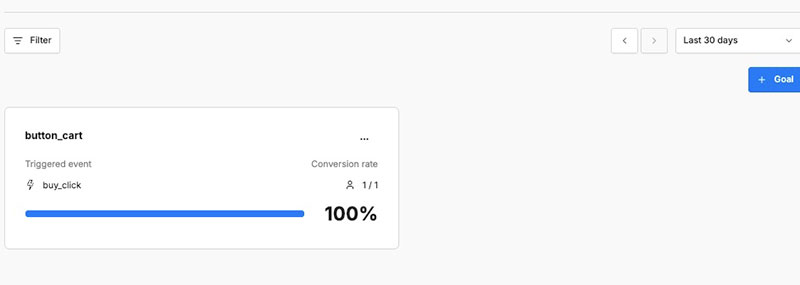
Define goals in Settings, then track them in your Goals report. See how many people achieved each milestone, conversion rates, and trends over time.
Advanced Reporting: Understanding User Behavior
Umami’s reporting suite goes beyond pageviews. Use these reports to understand why visitors behave as they do.
Journey Report: Visualizing User Paths
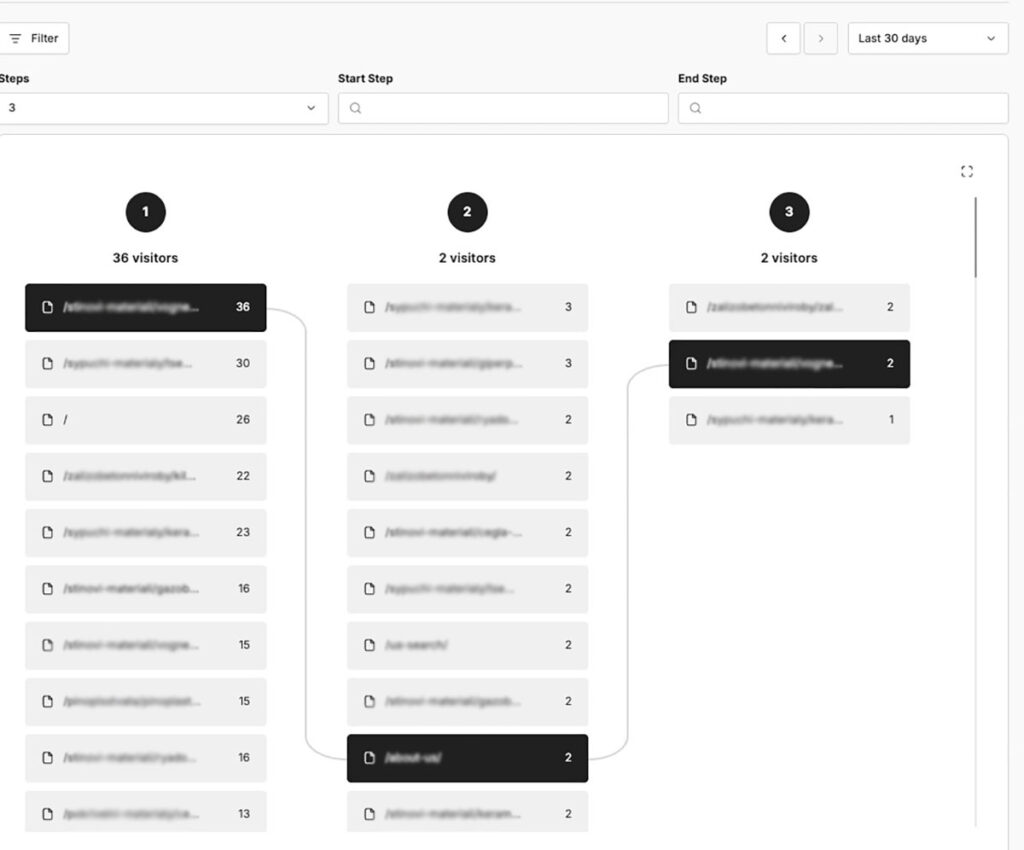
The Journey report is Umami’s most powerful feature for understanding behavior. Instead of isolated metrics, it visualizes the actual sequence of steps visitors take.
Example: You run an SaaS platform. Create a journey from:
- Landing page → 2. Pricing page → 3. Signup → 4. Onboarding
The report shows:
- How many visitors took this exact path
- Where people diverged from the path
- Which alternative routes they took instead
- Drop-off rates at each step
This reveals friction. If 1,000 people view your pricing page but only 50 start signup, something’s wrong. Is the pricing confusing? The CTA unclear? The signup form too long? Journey reports highlight where to investigate.
You can customize:
- Number of steps (3 to 7)
- Starting page/event
- Ending page/event
- Date range
- Segments (mobile vs. desktop, by country, by source)
Retention Report: Measuring Stickiness
How often do visitors return? The Retention report tracks this.
Common insights:
- “We have 10,000 visitors, but only 5% come back”
- “Day-7 retention is 40%—our onboarding needs work”
- “Mobile users return 3x less than desktop users”
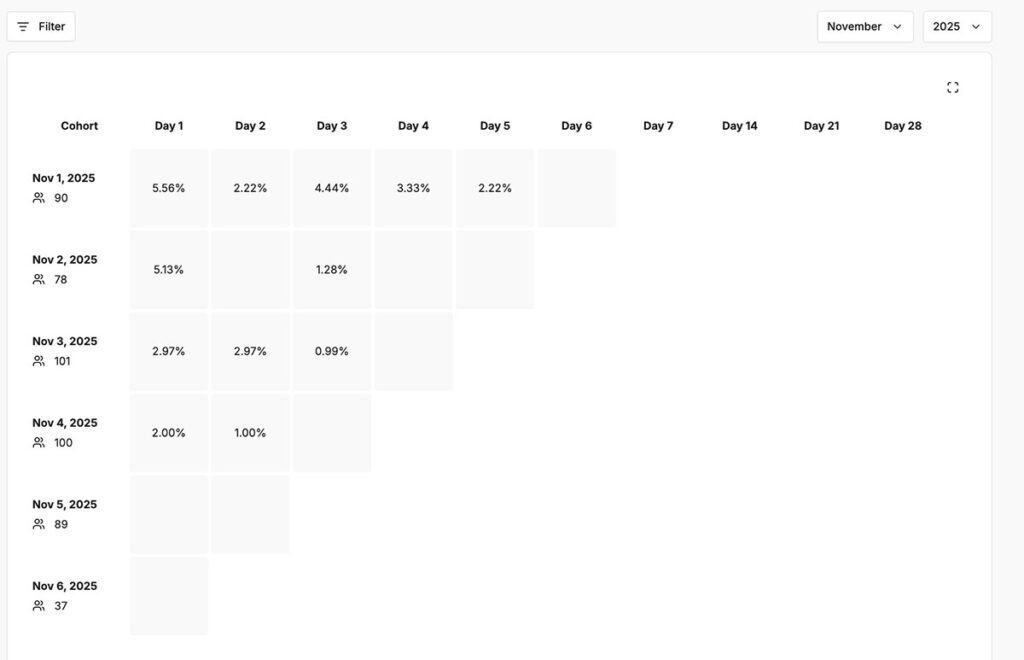
Use retention data to:
- Validate product/content quality
- Measure onboarding effectiveness
- Identify user churn triggers
- Compare different cohorts (mobile vs. desktop, new vs. returning)
Funnel Report: Tracking Conversion Sequences
Funnels are sequential processes you want to measure:
E-commerce funnel:
- Browse products (1,000 users)
- Add to cart (600 users – 60% drop-off)
- Start checkout (400 users – 33% drop-off)
- Complete purchase (360 users – 10% drop-off)
The funnel reveals exactly where you lose people. The biggest drop lands on the add-to-cart move. This suggests something wrong with the product pages or add-to-cart experience.
Funnels are fully customizable and can include any pages or events. You can build multiple funnels for different user flows.
Insights Report: Segmentation and Filtering
Deep-dive into specific slices of your data:
- Compare “Desktop users in US” vs. “Mobile users in EU”
- See how a specific traffic source performs across different pages
- Analyze behavior by browser or OS
- Create custom cohorts based on events
Official Umami Cloud Pricing vs. Self-Hosted Costs
Umami has restructured its cloud plans, so most third-party comparisons still quote tiers that no longer exist. The numbers below come straight from the official Umami Cloud pricing page — I re-checked them in July 2026. If you’re reading this much later, spend the 30 seconds to confirm before you budget.
Umami Cloud Plans
| Plan | Price | Events / Month | Websites | Retention | Notable Extras |
|---|---|---|---|---|---|
| Hobby | Free | 100K | 1 | 6 months | Community support |
| Pro | $20/mo | 1M included | Up to 20 | 2 years | Up to 10 team members, API access, email support |
| Business | $200/mo | 10M included | Unlimited | 5 years | Unlimited team, session replays, heatmaps, white-labeling, streaming API |
| Enterprise | Custom | Custom | Unlimited | Custom | SAML SSO, uptime SLA, invoice billing, onboarding support |
Importantly, going over your event limit doesn’t cut off data collection. Instead, extra events are billed per event: $0.00003 on Pro (that’s $3 per additional 100K) and $0.00002 on Business. On top of that, paid plans come with a 14-day free trial, billing is monthly, and you can cancel anytime — no contracts.
Every plan — including the free one — gets the full reporting suite: funnels, retention, user journeys, goals, UTM parameters, revenue, attribution, custom events with properties, realtime view, custom dashboards, and data export. What you pay for is capacity (events, websites, retention) and team features, not reports.
How Umami Counts Events
Per the official FAQ, usage is measured in events, and the definition is broader than “pageview”:
- Each pageview = 1 event
- Each custom event = 1 event
- Each stored event property = 1 more event
That last line is the one people miss. A single umami.track('purchase', { value: 99, currency: 'USD' }) call costs 3 events, not 1 — the event itself plus two properties. For scale, a site with 20,000 visits and 2.5 pages per visit burns ~50K events on pageviews alone; layer property-rich event tracking on top and you can double that without noticing. Budget accordingly.
The Free Plan: What Hobby’s $0 Buys You
Hobby is a genuinely usable free plan, not a demo: 100K events per month, 1 website, 6 months of data retention, community support, no credit card. In pageview terms, that’s roughly 40,000 visits a month at 2.5 pages per visit — more traffic than most personal blogs and side projects will ever see.
Still, the real constraints aren’t the event cap. They’re the single website and the 6-month retention window — you can’t do year-over-year comparisons on Hobby, because last year’s data is simply gone. If your traffic is seasonal, that hurts more than any event limit.
In practice, three things push you off the free plan: a second website, needing more than 6 months of history, or property-heavy event tracking that eats the 100K budget. Hit any of them and Pro at $20/month is the next stop.
Self-Hosted Umami: Free Software, Not Free Ownership
By contrast, the open-source version is completely free with unlimited events, websites, and retention. You only pay for the server:
| Server Type | Monthly Cost | Suitable For |
|---|---|---|
| Shared hosting | $2–5 | Low-traffic sites |
| Cheap VPS | $3–6 | Small to medium sites |
| Mid-tier VPS | $10–20 | High-traffic sites |
| Managed hosting | $15–50 | Full hands-off approach |
Umami is lightweight — even a $3/month VPS handles 100K+ monthly visits. But be honest about the trade: you own updates, backups, security patches, and a Postgres database that grows forever. There’s no SLA, and per Umami’s own FAQ, some Cloud features (email reports, the streaming API) don’t exist in the self-hosted version at all. Session replays and heatmaps are Business-plan Cloud features, too.
Where the Costs Cross Over
My take:
- One site, normal traffic → the free Hobby plan wins outright. Self-hosting to “save money” now costs money: a $5 VPS runs $60/year to replace something Umami gives away for free.
- 2–20 sites → Pro at $20/month ($240/year) vs. a $5 VPS ($60/year) is a $15/month difference. If you bill for your time, one hour of server maintenance per month erases the “savings.” Self-host only if you already run infrastructure anyway.
- Data sovereignty or long retention requirements → self-host. Unlimited retention and full data control on your own hardware beat any plan tier.
- Agency scale (dozens of sites, replays, white-labeling) → Business at $200/month, or self-host with a real ops budget. There’s no cheap middle option anymore.
Setting Up Umami: Cloud vs. Self-Hosted
Cloud Setup (5 minutes)
- Go to umami.is and sign up
- Create an account with email/password
- Add your website domain
- Copy the tracking script:
xml<script defer src="https://cloud.umami.is/script.js" data-website-id="YOUR_ID"></script>
- Paste into your site’s
<head>before</head> - Verify installation (dashboard shows “Active” status)
Done. Tracking starts immediately.
Self-Hosted Setup (Docker, 20 minutes)
Requirements: A Linux VPS or server with Docker installed. For more detailed deployment instructions, see step-by-step guide to Docker Compose deployment
Create docker-compose.yml
textversion: "3"
services:
  postgres:
    image: postgres:15-alpine
    environment:
      POSTGRES_DB: umami
      POSTGRES_USER: umami
      POSTGRES_PASSWORD: your_secure_password_here
    volumes:
      - umami-db-data:/var/lib/postgresql/data
    restart: unless-stopped

  umami:
    image: ghcr.io/umami-software/umami:postgresql-latest
    environment:
      DATABASE_URL: postgresql://umami:your_secure_password_here@postgres:5432/umami
      DATABASE_TYPE: postgresql
      APP_SECRET: $(openssl rand -base64 32)
    depends_on:
      - postgres
    ports:
      - "3000:3000"
    restart: unless-stopped
Launch with Docker
bashdocker-compose up -d
Access the Dashboard
Visit http://your-server-ip:3000 and log in with default credentials (admin/umami).
Add Your Website
In the dashboard, click Add website, enter your domain, and copy the tracking code (same format as cloud).
Set Up a Custom Domain (Optional)
Use Caddy or Nginx as a reverse proxy to access Umami at your domain:
texthttps://analytics.yourdomain.com
Configuration is straightforward; documentation is excellent.
Event Tracking Mastery: Practical Examples
Events are the difference between “I know I had 1,000 visitors” and “I know 50 users started my free trial, 30 completed onboarding, and 12 upgraded to paid.”
Example 1: SaaS Sign-Up Funnel
Track the entire onboarding process:
xml<!-- On landing page -->
<button data-umami-event="Clicked sign-up CTA" data-umami-event-source="landing">
  Start Free Trial
</button>

<!-- On signup form -->
<input type="email" data-umami-event="Email entered" />
<button data-umami-event="Form submitted" data-umami-event-form="signup" />

<!-- On confirmation page -->
<div data-umami-event="Email verified" data-umami-event-email="true">
  Verification complete
</div>

<!-- After user adds first project -->
<script>
  umami.track('First project added', {
    project_type: 'web',
    user_id: 'abc123'
  });
</script>
Now create a funnel:
- “Clicked sign-up CTA” → 2. “Form submitted” → 3. “Email verified” → 4. “First project added”
The dashboard shows exactly where sign-ups are lost.
Example 2: E-Commerce Product Interaction
xml<!-- Product page -->
<button data-umami-event="Product viewed"
        data-umami-event-product-id="SKU123"
        data-umami-event-price="99.99">
  View Details
</button>

<!-- Add to cart -->
<button data-umami-event="Added to cart"
        data-umami-event-product="Winter Jacket"
        data-umami-event-price="99.99"
        data-umami-event-quantity="1">
  Add to Cart
</button>

<!-- Checkout completion -->
<script>
  umami.track('Purchase', {
    order_value: 299.97,
    items: 3,
    coupon: 'SAVE20'
  });
</script>
Create goals for each event to track conversion rates and revenue impact.
Example 3: Content Engagement
xml<!-- Video player -->
<video data-umami-event="Video played"
       data-umami-event-video-id="abc"
       data-umami-event-duration="120">
</video>

<!-- Article read tracking -->
<script>
  // Scroll depth tracking
  window.addEventListener('scroll', () => {
    const scrollPercent = (window.scrollY / document.body.scrollHeight) * 100;
    if (scrollPercent > 50) {
      umami.track('Article 50% read', { article_id: '12345' });
    }
  });

  // Time on page
  setTimeout(() => {
    umami.track('Article engaged', { time_on_page: 180 }); // 3 minutes
  }, 180000);
</script>

<!-- Newsletter signup -->
<button data-umami-event="Newsletter signup"
        data-umami-event-location="article-bottom">
  Subscribe
</button>
Track which content drives engagement, signups, and repeat visits.
Comparing Umami vs. Alternatives
Umami vs. Google Analytics
| Feature | Umami | GA4 |
|---|---|---|
| Setup time | 2 minutes | 20+ minutes |
| Learning curve | 5 minutes | 2+ weeks |
| Privacy focus | Built-in | Afterthought |
| Compliance | GDPR-first | Requires work |
| Cookie banner | Not needed | Required by law |
| Script size | Minimal | ~70 KB |
| Cost | Free (100K events/mo), $20/mo Pro, or self-host free | Free (surveillance) |
| Data ownership | 100% yours | Google’s advertising |
| Reports quality | Focused/essential | Overwhelming |
| Journey mapping | Yes (visual) | Yes (complex) |
| Self-hosting | Yes (free) | No |
Winner for: Privacy-conscious site owners, developers, those who want simplicity
Umami vs. Plausible
| Feature | Umami | Plausible |
|---|---|---|
| Simplicity | Simple | Simpler |
| Features | More options | Minimal |
| Self-hosting | Free, unlimited | Free, limited |
| Cloud pricing | Free plan, then $20/mo | From $9/mo, no free plan |
| Custom events | Yes, flexible | Yes, but fewer |
| Reports depth | Detailed | Compact |
| WordPress plugin | Community-built | Official |
| E-commerce | Manual setup | WooCommerce native |
| User journeys | Visual/interactive | Not available |
Winner for: Umami excels if you need custom events and journey mapping. Plausible if you want maximum simplicity
Real-World Use Cases
Freelancer Running a Tech Blog
Umami (free self-hosted) tracks which articles drive traffic, newsletter signups, and affiliate link clicks. Events track newsletter CTAs and download conversions. Dashboard shows 100-line blog gets 5,000 visitors/month from Google organic. Revenue potential is clear.
SaaS Startup (Plausible, Umami)
Both tools track free trial signups, onboarding completion, and feature adoption. Umami’s journey report reveals that users who complete the “Connect integrations” step have 40% higher retention. The team optimizes onboarding around this insight.
E-Commerce Store
Self-hosted Umami tracks products viewed, cart abandonment, and purchase value. Filtering by traffic source shows email campaigns convert at 8%, while Google Ads at 2%. Budget shifts to email.
Agency Managing 50 Websites
At this scale you need the Business plan ($200/month, unlimited websites and team members) or a self-hosted instance. Create dashboards for each client, invite team members per website, and generate CSV reports for weekly client emails. Funnels highlight which client sites have UX issues.
Multi-Language Support
Umami supports 20+ languages including:
- English, Spanish, French, German, Italian
- Russian, Polish, Ukrainian, Czech
- Chinese (Simplified & Traditional), Japanese, Korean
- Arabic, Persian, Hindi
- And more…
Simply click the globe icon in the header to switch languages. Perfect for international teams or selling to non-English-speaking audiences.
Team Collaboration and Permissions
Invite team members with granular permissions:
- Owner: Full access to all settings
- Editor: Can modify dashboards, goals, events
- Viewer: Read-only access
Perfect for agencies, teams, or delegating analytics management.
Continue Learning
Explore more privacy-focused analytics content:
- Cookieless tracking strategies — how to track without cookies across industries
- Do you need analytics at all? — when simpler is better
- Beyond pageviews — metrics that actually matter
Conclusion: The Right Time to Switch
Umami represents the future of web analytics: simple, private, and transparent. It consistently earns a spot in independent roundups of GDPR-compliant Google Analytics alternatives. Whether you choose cloud or self-hosted, you get a tool built for modern web needs, not surveillance capitalism.
The decision is straightforward:
- Tired of Google Analytics complexity? → Umami
- Want full data control? → Self-host Umami
- Need custom event tracking? → Umami (more flexible than Plausible)
- Manage multiple sites? → Umami Cloud Pro ($20/month, up to 20 websites) or self-host for unlimited
- Value your visitors’ privacy? → Umami (GDPR by design)
The free Hobby plan (no credit card required) or instant setup (self-hosted) costs nothing. One hour of switching saves months of frustration navigating GA4’s labyrinth.
Make the switch. Your dashboard will finally make sense.