Tracking Setup
How to Check If GA4 Is Installed (and Actually Firing)
Tips & Fixes · GA4 debugging
Three checks, sixty seconds, one verdict. The short version of how to check if GA4 is installed on a page: open the page, press F12, switch to the Network tab, type collect into the filter box, and reload. If a request goes out to google-analytics.com carrying a tid that starts with G-, the tag is installed and firing on this page. If gtag.js loads but no collect request follows it, GA4 is not tracking this page — no matter how much tracking code sits in the HTML.
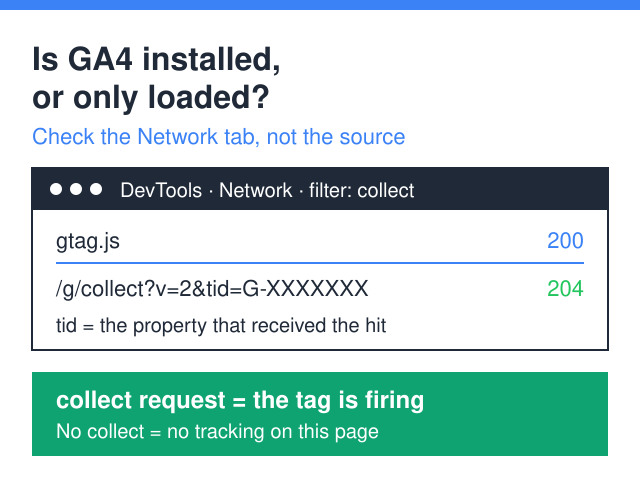
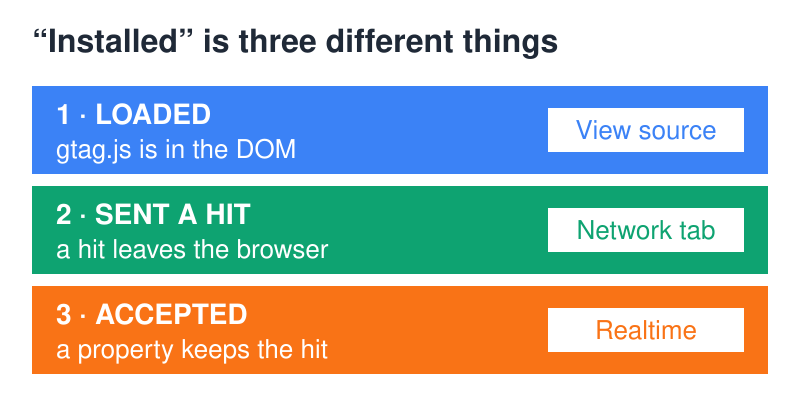
That one request is the whole answer, because “installed” is actually three separate things: the script loaded, the script sent a hit, and the hit was accepted into a property. In the tickets that land on my desk, the second gap is the usual suspect. It’s also the one most walkthroughs skip, because they stop at “the code is on the page” and call that installed.
Then check the clock before you panic. A hit shows up in Realtime within minutes, while standard reports run on a processing delay that Google publishes in its data freshness reference — hours rather than seconds, and longer again for daily tables. An empty report this morning proves nothing about the tag you deployed last night.
Is GA4 code on this page? Three ways to answer, worst to best
- Search the page source for
G-. View page source, Ctrl+F,G-orgtag. Fast, and wrong often enough to be dangerous: it reads the HTML the server sent, not the page the browser ended up with. - Type
window.dataLayerin the console. An array containingconfigor aG-XXXXXXXstring means the tag exists in the live DOM. Better — it sees the page after JavaScript has run. Still only proves the code is present, not that it did anything. - Filter the Network panel by
collect. The only method that proves a hit left the browser. The GA4 request appears as/g/collectagainstgoogle-analytics.com(or a regional variant such asregion1.google-analytics.com), withv=2and your measurement ID intid. Click it and read the ID straight out of the query string.
Why view-source lies when the tag comes from GTM
This is the most common reason I see someone conclude “there’s no code on this page” while analytics works perfectly. When GA4 is deployed through Google Tag Manager, the HTML your server returns contains only the container snippet — the Google tag is written into the DOM later, after the container executes. View-source shows the document as it arrived and never runs the JavaScript. So the G- ID is genuinely absent from the source and genuinely present on the page.
Use Inspect instead and you’ll see the injected script. Or go straight to Network, which doesn’t care how the tag got there. If the container is the suspect, our walkthrough on checking whether GTM is working properly covers preview mode.
What each verification method proves — and what it doesn’t
Every method has a blind spot, and picking the wrong one costs an afternoon on the wrong layer.
| Method | Proves | Does not prove | Delay | Works without account access? |
|---|---|---|---|---|
| View page source | The ID is hardcoded in the server response | That the tag runs, fires, or is valid | None | Yes |
DevTools → Network (collect) |
A hit left the browser, with a readable measurement ID | That any property accepted it, or that it survived filters | None | Yes |
| GA4 Realtime | Data reached the property and passed processing | Which page or tag produced it; anything filtered out | A few minutes | No |
| GTM Preview / Tag Assistant | Which triggers matched and which tags fired | Anything about tags installed outside the container | Live | No — needs container access |
| GA4 DebugView | Individual events and parameters as GA4 received them | Normal visitor behaviour — debug-flagged sessions only | Seconds | No |
Read the table as one sentence: loaded ≠ sent a hit ≠ accepted into a report. A missing script is a deployment problem. A script that loads without firing is a consent, trigger or blocker problem. A hit that never surfaces is a property, filter or patience problem. Diagnosing the wrong layer is why “the code is there” and “the reports are empty” are both true at once.
“We could not find any Google Analytics tracking codes on the index page of your site”
That message comes from automated site auditors, and it panics people with a perfectly healthy setup. A scanner is a crawler with a short attention span. Six things make it miss a working tag.
- The page renders on the client. React, Vue and most headless setups ship a near-empty HTML shell, and scanners that don’t execute JavaScript see nothing. Tell it apart: Inspect shows the tag, View source doesn’t.
- The tag is deployed through GTM. Same mechanism — the container is in the HTML, the Google tag isn’t. Tell it apart: search the source for
GTM-instead ofG-. - Consent mode is sitting at denied. Before anyone clicks the banner, a basic implementation holds the tag back. Tell it apart: accept cookies, reload, watch Network. A hit that appears only after consent means your consent mode configuration is doing its job.
- A Content Security Policy blocks the domain. If
www.googletagmanager.comorwww.google-analytics.comisn’t allowlisted inscript-src/connect-src, the browser kills the request. Tell it apart: the Console prints an explicit CSP violation. That one is a real break. - Bot protection serves the scanner a different page. Cloudflare rules and challenge pages return a stripped response to anything that doesn’t look like a browser. Tell it apart: compare what
curlgets with what your browser gets. - The tag isn’t on the homepage. Auditors check the index page only, and a tag deployed on templates but missing from the front page is common after a redesign. Tell it apart: run the Network check on the homepage itself.
Only two of those six — CSP and a genuinely missing homepage tag — are worth a ticket. The rest are the scanner’s limitation, not yours.
The tag fires but the reports stay empty
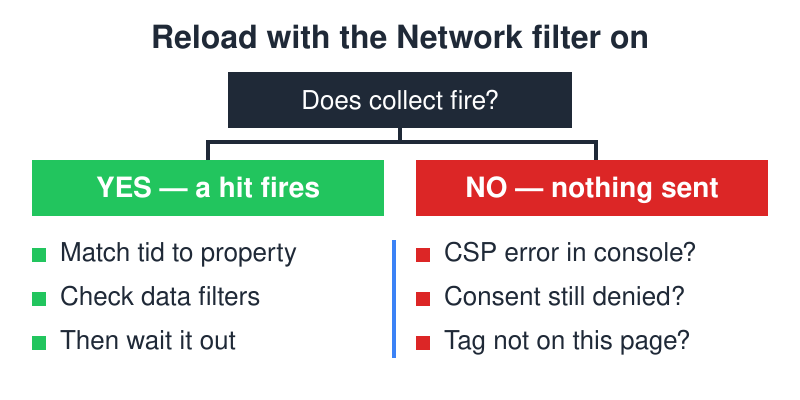
Four suspects, in the order I check them.
Consent is denied and the hit is cookieless. Under advanced consent mode the tag still sends something: Google documents that cookieless pings are sent to Google Analytics and used for behavioural and conversion modelling. So a request in Network doesn’t guarantee a normally attributed user.
Two measurement IDs on one page. Usually a leftover hardcoded tag plus a newer GTM deployment. Count the collect requests: two hits per pageview with different tid values means your data is split across two properties — or duplicated inside one. The GTM Container Linter flags duplicate Google tags in a container export.
An internal traffic filter is eating your own visits. The cruellest one, because the person testing is always on the office IP. Google is explicit: with a filter set to Active, excluded data will never be available in Analytics or BigQuery. In Testing it isn’t dropped — Analytics tags the matching data with a Test data filter name dimension instead. Check Admin → Data settings → Data filters first; our guide to GA4 data filters covers each state.
You’re just early. Intraday tables and daily tables refresh on different schedules, and the gap between “the hit fired” and “the report agrees” is measured in hours. Late arrivals have a cutoff too: hits that reach Google long after the event happened are dropped rather than backfilled, so a device that was offline for days won’t quietly appear later. Look the exact windows up for your property type in the same data freshness reference linked above instead of guessing at them.
Which screen shows what
- DebugView — individual events with full parameters, seconds after they fire, but only for debug-flagged sessions (GTM Preview sets that flag for you).
- Realtime — aggregated activity within minutes, no parameter-level detail.
- Standard reports — everything, on the processing delay above.
Realtime empty while DebugView shows events usually means a filter, not a broken tag.
The event arrives but the parameter isn’t in any report
This is the failure mode that survives every check above, and it fools experienced people. The collect request fires. DebugView lists the event with all its parameters. Realtime counts it. Then you build a report, go looking for form_name or plan_tier, and the dimension simply isn’t in the picker.
Nothing is broken. Custom event parameters don’t become reportable on their own — you register them in Admin → Data display → Custom definitions first. Until then GA4 collects the value but gives you nothing to group by, which reads exactly like a tracking failure to whoever asked for the report.
One constraint is worth knowing before you start registering everything you can think of. Google’s configuration limits for GA4 cap a standard property at 50 event-scoped custom dimensions and 50 event-scoped custom metrics. That ceiling makes the slots worth rationing: a property that burned its dimensions on one-off experiments is a genuinely annoying thing to clean up.
Practical consequence for debugging: when someone says “the event isn’t tracking”, ask what they actually looked at. If DebugView shows the parameter and the report doesn’t, the tag is innocent and the fix is a definitions problem, not a deployment one.
Consent changes what “firing” means
A tag that fires isn’t automatically a tag that measures. Since March 2024, Google has required consent mode signals — including ad_user_data and ad_personalization — for traffic from the European Economic Area. The same requirement reaches the UK and Switzerland through Google’s own EU User Consent Policy, which names all three regions by name; that’s a Google policy condition, not the DMA, which doesn’t cover the UK. Different legal instrument, same practical outcome for your tags.
Miss the signals and you don’t lose the hit. You lose personalisation and remarketing for those users, plus part of the measurement functionality Google layers on top of consented data. On the Network panel that looks like success — the request goes out, status 204 — while the audiences downstream slowly stop working. That gap is why “is GA4 installed” and “is GA4 usable” are different questions.
Worth knowing on the legal side too: the EDPB’s Guidelines 2/2023 on the technical scope of Article 5(3) ePrivacy reached Version 2.0, adopted on 7 October 2024. The guidance reads that provision as covering storage and access on a user’s device broadly, not just classic cookies. So “cookieless” in a vendor’s marketing doesn’t automatically translate into “no consent needed” for your implementation — check the mechanism, not the label.
When you’re debugging on a site with a banner, test both states deliberately. Load the page and watch Network before touching the banner, then accept and reload. Two different behaviours tell you the consent wiring works; identical behaviour in both states tells you it doesn’t, in one direction or the other.
Eight things to confirm before you blame the developer
Run these in order. Together they cover how to check if GA4 is installed on a given page and whether what it sends will survive the trip into a report.
- A
collectrequest fires on page load, on the exact URL in question. - Its
tidmatches the measurement ID of the property you’re looking at, character for character. - Exactly one Google tag fires per pageview, not two.
- The Console shows no CSP violation and no blocked-resource error.
- The hit still fires after you accept the consent banner.
- Template pages beyond the homepage fire too — product, checkout, thank-you.
- No active internal or developer traffic filter is removing your test visits.
- You’ve waited past the processing window before calling the data missing.
Work through those and most escalations die on your own desk. To make it repeatable, the Tracking QA Checklist Generator builds a per-site version to hand to whoever deploys next, and the pre-launch tracking checklist covers the deployment side.
How to check if GA4 is installed on a site you don’t own
Client audits, competitor research, due diligence before an engagement — you can still get a real answer without a single credential. Network is the only method that works from outside: open the site, filter by collect, reload, read the measurement ID out of the request. That’s the whole procedure, and it takes longer to describe than to run.
What you can’t see: whether that ID belongs to a live property, whether the data is retained, whether filters discard it, whether the events mean anything. A hit leaving the browser proves the first link in the chain and nothing past it. Promising a client “your tracking works” on that evidence is how you end up explaining, months later, why the conversion data everyone planned around was never collected. Say “the tag fires” instead.
One more habit worth building for outside audits: check more than the homepage. Run the same filter on a product page, a form page and the post-submit page, because those three carry the events that anyone actually cares about. A homepage-only tag is the single most common half-installation I run into, and it looks completely healthy from the front door.
FAQ
Why is there no G- ID in my page source when analytics clearly works?
Almost always because the tag is deployed through Google Tag Manager, which injects it into the DOM after the container runs. It exists on the page but not in the HTML the server sent. Check the Elements panel or the Network tab instead of View source.
Realtime is empty — is my tag broken?
Not necessarily. Check Network first: if a collect request is going out, the tag is fine and the problem is downstream — an internal traffic filter excluding your IP, the wrong property open in front of you, or a mismatched measurement ID. Realtime updates within minutes, so longer silence points to a filter, not latency.
Can I check GA4 from a phone?
Not properly. Mobile browsers don’t expose a Network panel, so you can view source but not see the hit — back to the least reliable method. Use remote debugging from a desktop if you need to verify mobile behaviour.
Do I need Tag Assistant if I already use DevTools?
For “is the tag firing”, no — DevTools answers faster and works on any domain. Tag Assistant and GTM Preview earn their place one layer down: when the tag fires and you need to know which trigger caused it, or why a second tag didn’t.
Two G- IDs on one page — does that duplicate my data?
Depends whether they’re the same ID. Two different IDs feed two properties, usually because an old tag survived a migration, and each sees a partial picture. The same ID configured twice duplicates pageviews and inflates every downstream metric. Count the collect requests per pageview.
My custom event shows in DebugView but not in reports. Is it installed?
Yes, it’s installed and collecting. Event parameters only become reportable once you register them as custom definitions, and a standard property has a limited number of slots for that. Check Admin → Data display → Custom definitions before touching the tag.
Continue Learning
- How to add the GA4 tracking code to your website — if the verdict was “no tag at all”
- 10 common GTM mistakes that break your tracking — what produces a loading-but-not-firing tag
- GA4 spam traffic: detect, filter and block bot noise — when data arrives but can’t be trusted
The ten-second check that settles it
Next time someone tells you GA4 isn’t working, ask one question before opening anything: does a collect request leave the browser? That splits the problem in half in ten seconds, and it’s the only check that needs nobody’s account access. Everything else — property, filters, consent, custom definitions — sits on one side of that split or the other.
So the honest answer to how to check if GA4 is installed is that you’re really checking three things in sequence, and stopping at the first one is what turns a five-minute verification into a week of arguing with a developer who did nothing wrong.
Processing behaviour, cookieless-ping handling, data-filter states and custom-definition limits come from Google Analytics Help, linked inline. The consent mode requirement in force since March 2024 and the EEA / UK / Switzerland scope reflect Google’s published consent requirements and its EU User Consent Policy, linked inline. The ePrivacy reference is Version 2.0 of the EDPB’s Guidelines 2/2023, adopted on 7 October 2024. Endpoint paths and request parameters are described as observed in the browser Network panel. — Alex Morgan