You don’t need to be “a data person” to get value from website analytics. If you can read a speedometer or check your phone battery, you already understand the point: a few simple numbers help you decide what to do next. This article keeps things non-technical and shows exactly how basic analytics can answer everyday business questions.
“Do I really need analytics?” — the honest answer
If your site is a hobby with no goals, no. But if you care about any of the following, a tiny bit of measurement pays for itself quickly:
- Leads or sales: Are visitors finding the CTA and converting?
- Content reach: Which posts people actually read (and which they ignore)?
- Marketing spend: Which channels bring the right visitors—not just any visitors?
- User experience: Where do people drop off or get confused?
- Planning: What topics, products, or timings are worth doubling down on?

Analytics is not about spreadsheets; it’s about confidence. Even simple, high-level numbers can stop guesswork and unnecessary rework.
Myths that stop non-tech folks from measuring
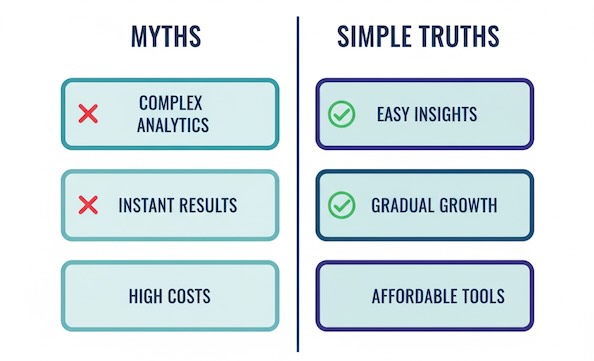
- “I’ll drown in numbers.” You only need a handful of metrics tied to your goals.
- “I don’t have time.” A 10-minute monthly check beats flying blind for a year.
- “I’ll need a developer.” Most basic reports are point-and-click in modern tools.
- “It’s only for big companies.” Small sites benefit the most because each decision counts more.
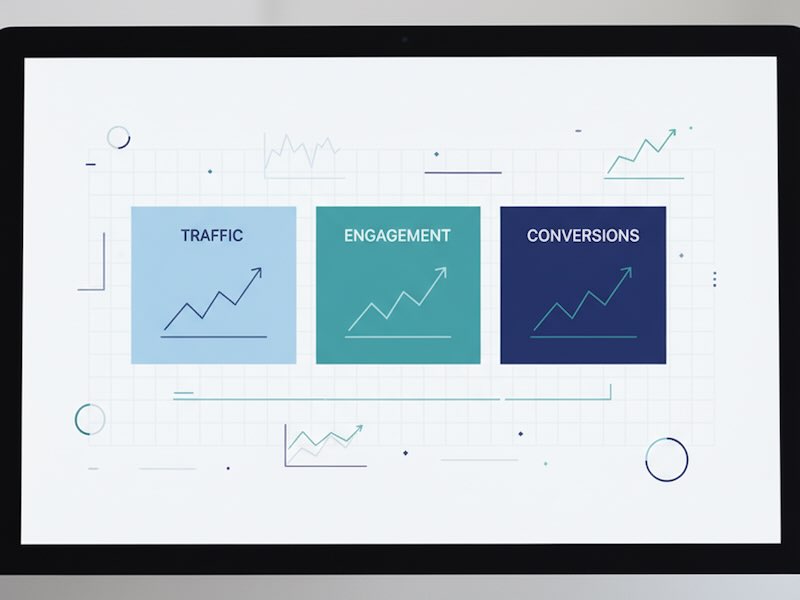
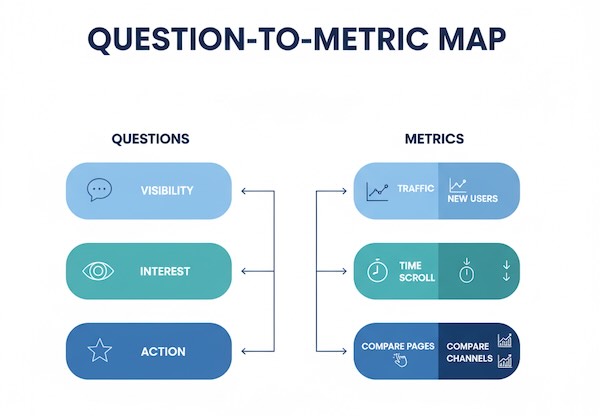
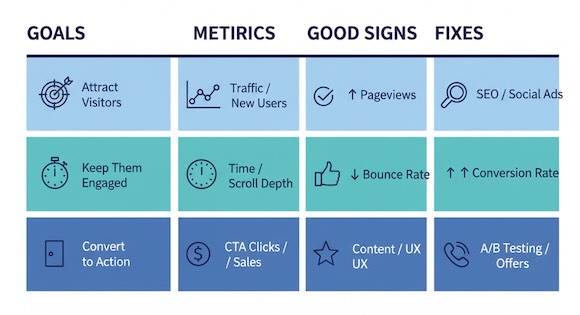
The questions analytics can answer in plain language
- Are people finding me?
Traffic and new visitors show visibility. - Do they like what they see?
Time on page, scroll depth, and return visits hint at interest. - Do they do what I hope?
Click-throughs to key actions (contact, demo, cart, subscribe). - What should I do more (or less) of?
Compare topics, pages, and channels to spot the winners and the time-wasters.
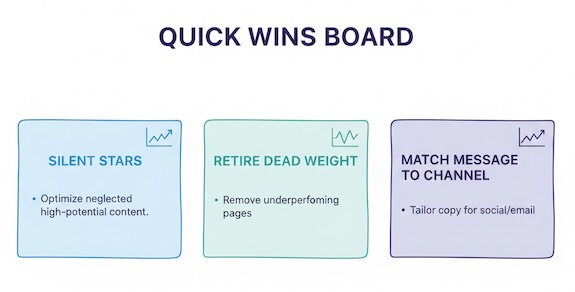
Quick wins you can get without being “techie”
- Spot “silent stars.” A page with steady traffic and good time-on-page deserves a prominent link or a soft CTA.
- Retire the dead weight. If a page gets views but zero next-step clicks, rewrite the intro and add a clearer call to action.
- Match message to channel. Social visitors skim; search visitors read deeper. Adjust headlines and layouts to fit.
The one-page review you can repeat monthly
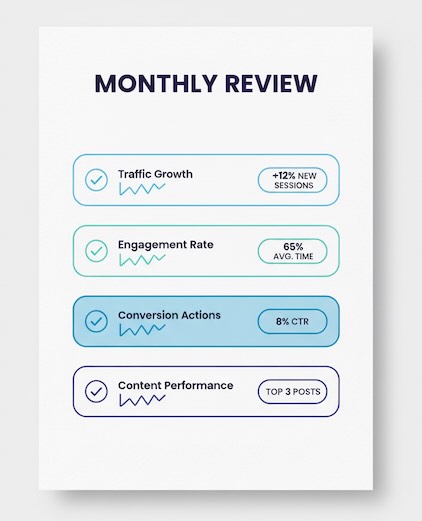
- Top 5 pages by visits—anything surprising?
- Top 3 traffic sources—which bring visitors who stay?
- One action you want (contact, signup, add to cart)—is it getting clicks?
- One improvement per weak page—note it, publish, and recheck next month.
That’s it. Keep a simple doc with these four bullets. You’ll see patterns fast.
A friendly reference table (bookmark this)
Use this as your “dashboard you can read at a glance.” No formulas, just plain English.
| Your goal | Simple metric to watch | What “good” often looks like | If it’s off, try this |
|---|---|---|---|
| Get more inquiries/sales | Click-through rate (CTR) on your main CTA | 2–5%+ of page viewers click your primary button/link | Move the CTA higher, make the copy specific (“Get a quote in 24h”), remove distractions near it |
| Know what content works | Views + average engaged time for each article | 2–4+ minutes on long reads; steady weekly views | Add a 2-sentence summary at top, clearer subheads, a relevant next step midway |
| Reduce confusion | Exit rate on key pages (pricing, checkout info) | Below peer pages; trending down month to month | Clarify benefits in first screen, add FAQs near decision points, trim optional links |
| Spend smarter | New users by source and their engaged time | Search/email traffic stays longer than social | Align ad/social headline with page promise; send social to a lighter, scannable version |
| Build loyalty | Returning visitors % (month over month) | Slow, steady growth; >20–30% for content sites | Offer a newsletter, highlight related posts, surface “most read” |
| Fix mobile pain | Mobile vs. desktop engaged time | Mobile within ~15–25% of desktop | Shorten paragraphs, compress images, bring the CTA above the fold on phones |
Note: “Good” varies by niche—use these as conversation starters, then tune to your audience.
Reading common patterns (without statistics)
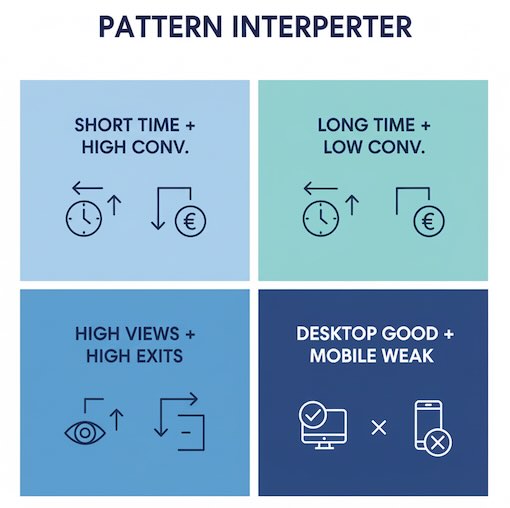
- Short time + high conversions → Fast path to action. Keep it lean.
- Long time + low conversions → Interest, but friction. Tighten copy, simplify choices.
- High views + high exits → People came for a specific answer and left satisfied—or disappointed. Check if the promise matches the page.
- Great desktop, weak mobile → Layout or load issue. Prioritize mobile polish first.
What success looks like for non-tech folks
- You can name your top three pages and why they work.
- You know which channel brings buyers, not just visitors.
- You track one main action and nudge it higher quarter by quarter.
- You make small, focused edits and see the numbers move in the right direction.
That’s analytics. Not dashboards. Outcomes.
Frequently asked (non-tech) questions
“What if my numbers are ‘bad’?”
They’re not a report card; they’re signposts. A dip tells you where to look, not that you failed.
“How often should I check?”
Monthly is fine for most small sites. Weekly during campaigns. Daily only if you enjoy it.
“Do I need benchmarks?”
Use your own history as the benchmark. Aim to beat your last month, not someone else’s.
“Which metric matters most?”
Whichever sits closest to your goal: leads sent, trial starts, “book a call” clicks—pick one primary, two supporting.
A simple, human way to start
- Write down your one primary goal for the site.
- Pick 3–5 metrics from the table that directly reflect that goal.
- Review once a month, make one change, and note the result.
- Celebrate small wins (a higher CTR, longer engaged time on a key page). Momentum matters.
Continue Learning
Ready to start? Here are practical next steps:
- How to add GA4 tracking code — simple setup guide for any website
- Do you need analytics at all? — the counterargument worth considering
- Beyond pageviews — which metrics actually matter for your goals
Bottom line
Analytics isn’t about being technical. It’s about seeing what’s working, fixing what isn’t, and spending your limited time where it pays back. With a tiny set of easy metrics—and a 10-minute monthly habit—you’ll make calmer, smarter decisions about your website, even if you never touch a line of code.
Leave a Reply