
Pageviews are the noisiest signal in analytics: easy to grow, hard to trust. If you want to understand real behavior, you need a tighter set of website engagement metrics that map attention to action. This guide lays out what to track, how to track it, and how to turn those numbers into decisions.
Why pageviews alone don’t cut it
- Single-page apps, infinite scroll, and tabs left open all distort counts.
- A long time on page without interaction can be idle time, not interest.
- Traffic mixes differ (email vs. paid social vs. search), so averages hide reality.
The core website engagement metrics
Use these as your baseline, then customize by business model.
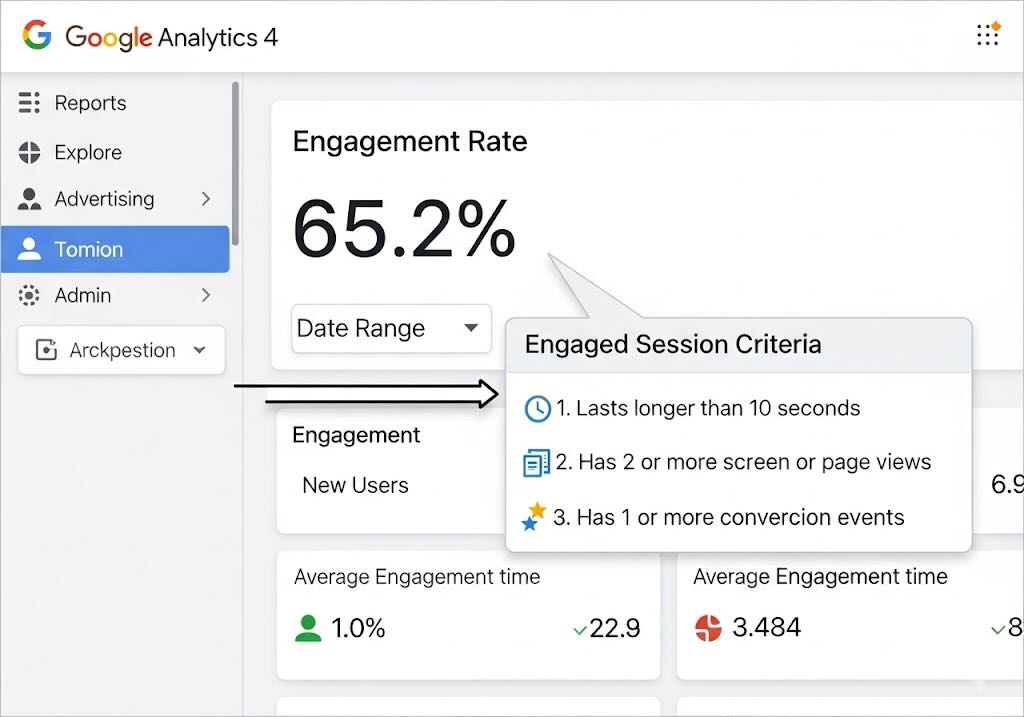
1) Engagement Rate (GA4)
A session is “engaged” if it lasts ≥10 seconds, has ≥2 page/screen views, or triggers a conversion. Website engagement rate is the share of sessions meeting that bar. It’s quick, comparable across segments, and resilient to vanity spikes.
2) Average Engaged Time per Session
Focus on engaged time (not simple time on page). It removes idle gaps and reflects actual attention on content, features, or product UI.
3) Events per User / per Session
Clicks on CTAs, plays, form starts, downloads, shares—your evidence of intent. Track totals and the mix (which events, not just how many).
4) Scroll Depth & Reading Completion
Measure 25/50/75/100% scroll and “read complete” for long content. For commerce, track viewing of key modules (reviews, specs, size guide).
5) Returning Users & Visit Frequency
Repeat visits signal perceived value. Watch 7-, 14-, and 28-day return rates and how they vary by source and content type.
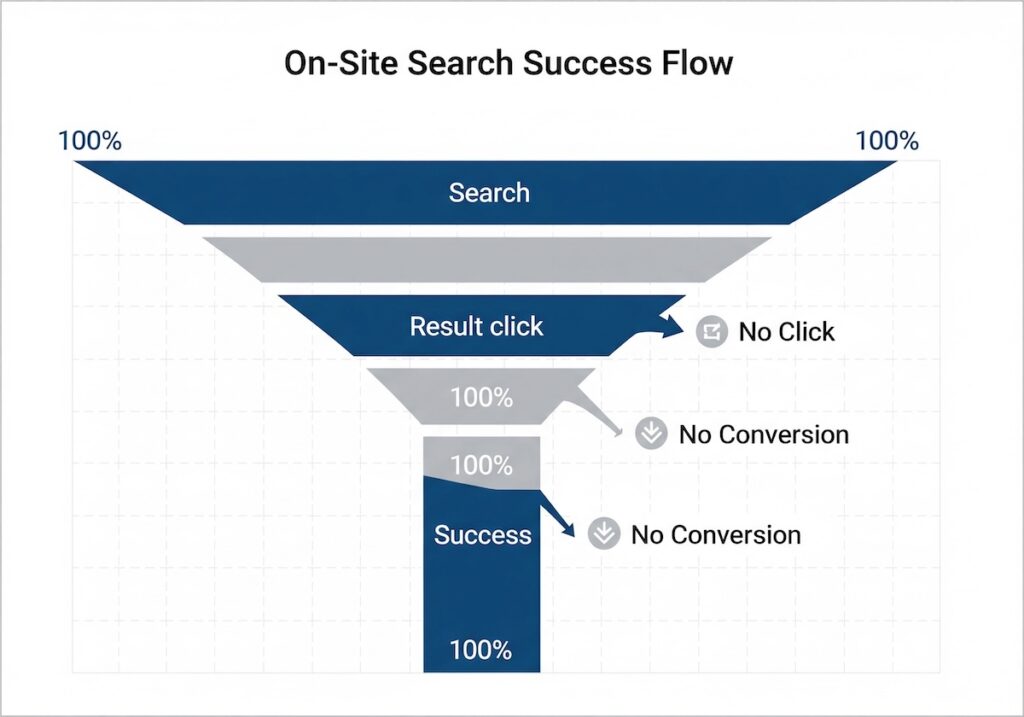
6) On-Site Search Usage & Success
Queries reflect unmet navigation. Success is clicks on search results and low “no results.” Great for content gaps and IA fixes.
7) Micro-Conversions
Newsletter signups, “add to wishlist,” “compare,” “copy coupon,” video ≥50%, PDF downloads—leading indicators that predict macro outcomes.
8) Experience Signals (Core Web Vitals)
Speed and stability don’t cause engagement but amplify it. Poor performance depresses all behavior metrics, especially on mobile.
These are your practical web analytics metrics for behavior. Tie them to outcomes (leads, trials, revenue) to graduate from “interesting” to “useful” key website metrics.
What is a good website engagement rate?
There’s no universal benchmark. Aim to be better than your baseline in each segment.
- Establish a 28–90 day baseline by channel, device, and page type.
- Compare against your own median and target the 75th percentile.
- Validate with outcomes: rising engagement that doesn’t correlate with conversions is noise.
Rules of thumb:
- Long-form editorial often shows higher engagement than product pages; that’s fine if product pages convert faster.
- On mobile, strong engagement with lower event counts can still be healthy if essential actions are easy and fast.
How to measure website engagement (step-by-step)
- Define signals of intent
Decide which actions matter: 50% scroll, video quartiles, “copy code,” “save,” form start/submit, CTA clicks. - Instrument clean events
Use GA4 Enhanced Measurement plus custom events via GTM/gtag. Name consistently (event_category,event_action,event_labelor GA4 parameters). - Mark key events as conversions
Micro-conversions (e.g., signup) and macro-conversions (purchase/lead). This lets you connect engagement → business. - Segment everything
Source/medium, campaign, device, new vs. returning, page type (blog, category, PDP, landing). Engagement is contextual. - Quality-check data
Use DebugView, filter bots, avoid double-fires, align timeouts, throttle auto-events that inflate counts. - Model reading and depth
Fire “read” when users hit both time and depth thresholds (e.g., ≥30s and ≥50% scroll) to avoid false positives. - Triangulate with UX tools
Funnels and paths in GA4 + heatmaps/session replays for qualitative nuance.
Key metrics for website performance by site type
Content sites / blogs
- Engagement rate → Avg engaged time → Read completion → Newsletter signup/return rate.
E-commerce - Engagement rate on PDPs → Interactions with key modules (images, size, reviews) → Add to cart/wishlist → Checkout start → Purchase.
SaaS / B2B - Engagement rate on feature pages → Video/demo plays → Trial/lead → Activation (product analytics).
Turn website analytics metrics into business outcomes
- Micro-to-macro lift: Compare conversion rates for users who hit your micro-signals vs. those who didn’t. If lift is weak, redefine signals.
- Path exploration: Identify event sequences that most often precede conversion; streamline those paths in UX.
- Attribution sanity: Don’t credit “time on page.” Credit event chains that reliably predict revenue or qualified leads.
Common pitfalls (and fixes)
- Chasing time on page. Use engaged time and read completion; time alone can be idle.
- One average to rule them all. Always segment by device and acquisition.
- Over-instrumentation. Too many low-value events drown signal. Prune quarterly.
- Ignoring speed. Improve Core Web Vitals to unlock higher engagement and conversion—especially for mobile and paid traffic.
Build a practical dashboard (your working set of website analytics metrics)
Organize one screen from attention → action → outcome:
- Attention: Engagement rate, Avg engaged time (by channel/device/page type)
- Action: Events/user, read completion %, on-site search success, video ≥50%
- Outcome: Micro-conversion rate, macro-conversion rate, revenue/lead quality
- Amplifiers: Core Web Vitals percent passing, page weight, error rates
Add sparklines for 28/90-day trends and highlight deltas vs. baseline to make change obvious.
Implementation checklist
- Event taxonomy documented and shared with marketing/product.
- Micro-conversions tagged as GA4 conversions.
- Scroll + time combo for “read.”
- Campaign UTM standards enforced.
- Bot filters and QA process in place.
- Quarterly event hygiene (merge, rename, delete).
- Cohort view for returning users and email-driven visits.
Summary: the short list that matters
Your enduring key metrics for website performance are:
- Engagement rate (segment-level), Average engaged time, Events per user/session, Depth/Read completion, Returning users, On-site search success, Micro-conversion rate—supported by Core Web Vitals.
Continue Learning
Dive deeper into analytics and tracking:
- Event tracking basics — capture the events that matter
- User flow analysis — understand the full user journey
- From sessions to journeys — advanced path analysis
Bottom Line
Treat these website engagement metrics as hypothesis fuel, not trophies. When they rise in the same segments where conversions and revenue rise, you’ve moved beyond pageviews and into meaningful growth.
Leave a Reply