Open any analytics dashboard and you’ll probably see the same classics: visitors, sessions, pageviews. Nice graphs, big numbers… but they don’t tell you what people actually did on your site. Did they read anything, play a video, try your product, almost convert, or just bounce?
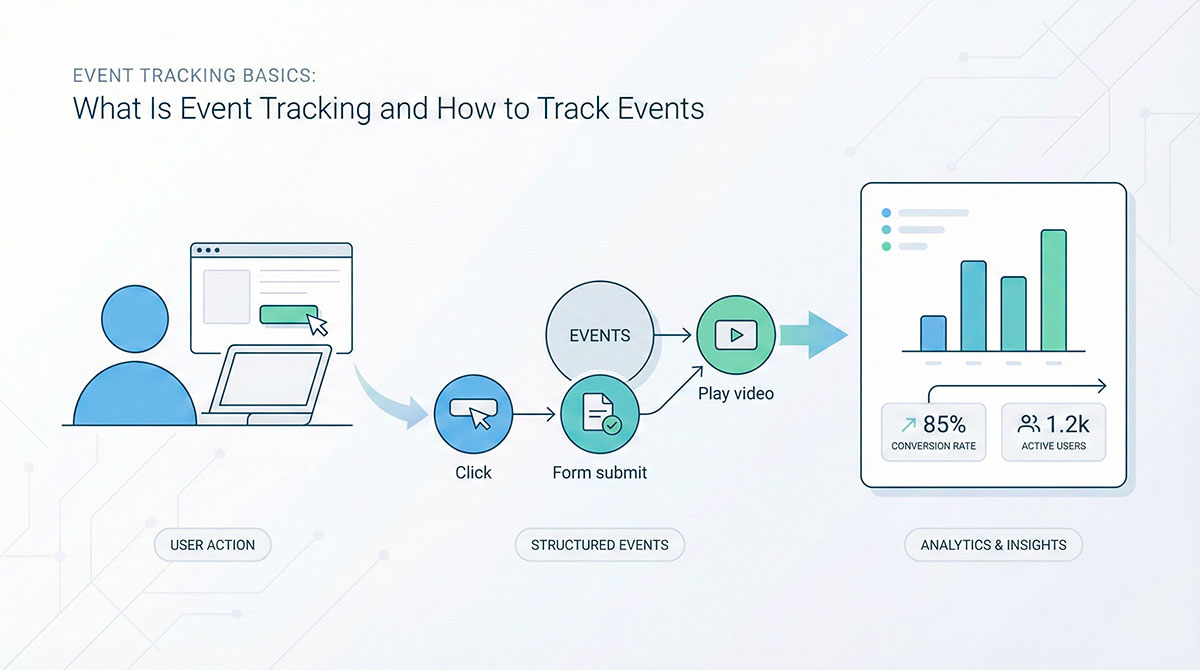
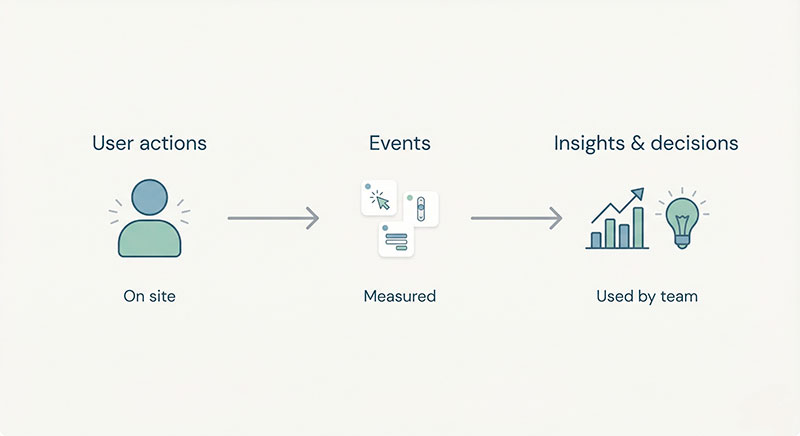
In modern analytics, an event is simply a user action you care about: clicking a button, submitting a form, watching a video, using a feature, adding a product to a cart, or completing a purchase. Each action can be turned into a tiny, structured record that says: “Someone did this on that page at this moment.”
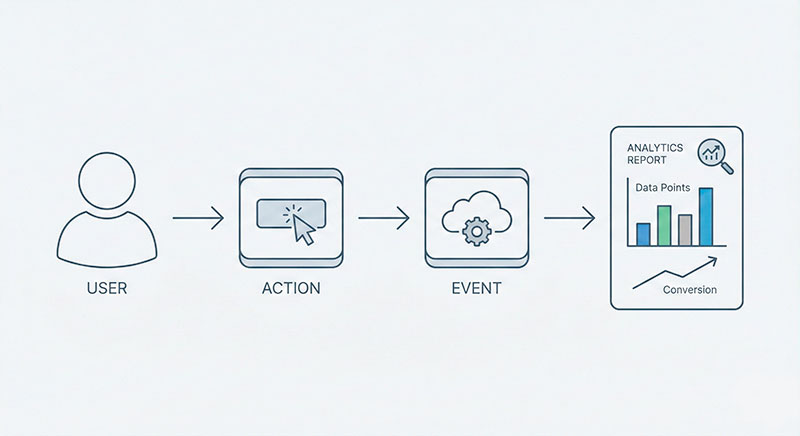
When people talk about event tracking, they usually mean the practice of turning those important user actions into structured data that analysis tools can understand and report on. Instead of only counting how many times pages loaded, you start listening to the meaningful moments inside each visit.
This shift matters because your data can either be a clear story or a wall of noise. If you turn every tiny click into an event, your reports become cluttered and confusing. If you choose a small, smart set of actions that reflect value, your data becomes much easier to read and trust.
In this article, we’ll walk through how to think about events on your website, how to decide which actions actually deserve to be measured, how to interpret event-based data, and how this mindset changes the way you look at marketing performance.
Website Event Tracking: From Simple Pageviews to Real User Behavior
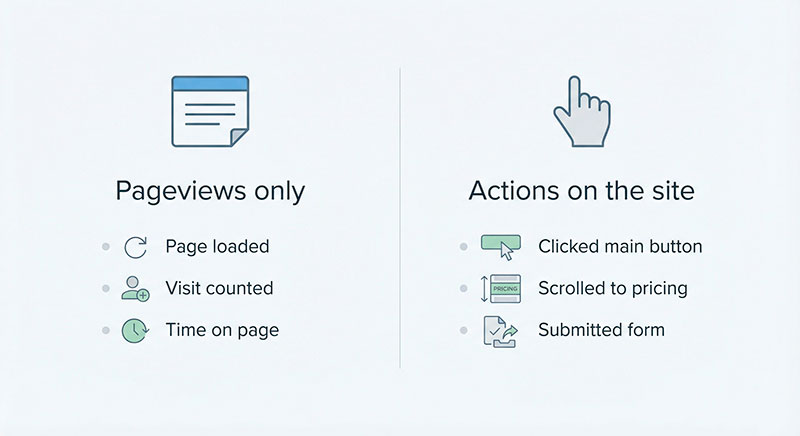
At the simplest level, tracking events on your site means you stop judging performance only by “how many visits we had” and start asking “what did people actually do while they were here?”. Pageviews tell you that someone opened a page; events tell you if they interacted with anything that matters.
If you only look at page and session counts, you see the shape of traffic but not the story behind it. If the basics like pageviews, sessions, and users still feel a bit confusing, this short guide to pageviews, sessions, and users walks through the differences with simple examples and makes the standard metrics much easier to read.
Once that foundation is clear, you can think about what meaningful actions look like on different types of sites:
- Simple landing page
- Clicks on primary call-to-action buttons.
- Scroll reaches of important sections (features, pricing, testimonials).
- Form submissions for leads or contact requests.
- Content site or blog
- How far people read within key articles.
- Clicks to related or “next” articles.
- Newsletter sign-ups or content downloads.
- SaaS or product site
- Sign-ups and logins.
- Interactions with core features (e.g. using a calculator, creating a project).
- Actions that show deeper interest, like viewing pricing or starting a trial.
You don’t need to capture every micro-interaction. The goal is to choose actions that reveal intent or value: someone trying a feature, getting closer to purchase, or showing real engagement, not just passing by.
From Pageviews to Actions: Why Events Feel Closer to Reality
Imagine a physical store. Counting only how many people walked in tells you something, but not enough. You also want to know who looked around, who asked a question, who tried something on, who came back twice, and who walked straight out.
Events are the digital version of those meaningful actions. When you start to see them, your analytics stops being a door counter and starts looking more like a real conversation with your visitors.
Analytics Events Tracking: Choosing Which User Actions Really Matter
Capturing user actions is easy; deciding which ones truly deserve space in your reports is the real work. Your analysis will always reflect the priorities you encode into it. If you treat every tiny click the same, the important signals will drown in noise.
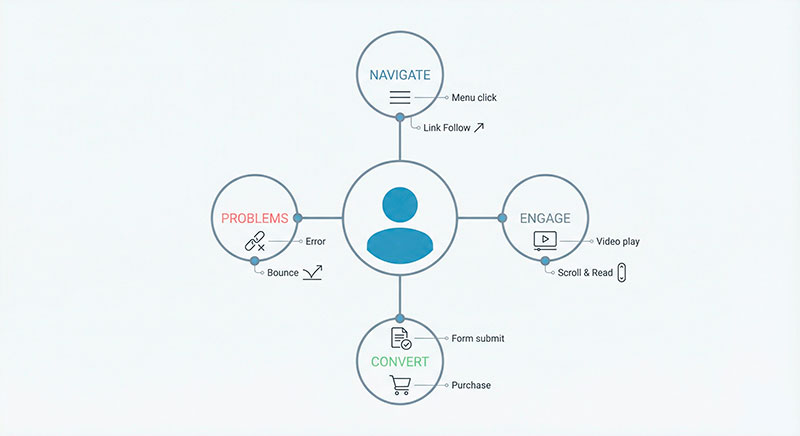
A helpful way to think about events is to group them into a few natural categories:
- Navigation-related actions
People moving through your site: clicking menu items, jumping to key sections, visiting important internal pages like “Pricing” or “Features”. - Engagement actions
Signs that someone is actually interacting with content: playing or pausing a video, expanding a FAQ item, using a comparison table, scrolling to a key block. - Conversion-like actions
Moves that show intent or deliver value: submitting a contact form, creating an account, adding items to a cart, beginning a checkout, requesting a demo. - Problem or friction actions
Moments where things go wrong: failed form submissions, “no results” searches, errors in a flow, clicks on elements that don’t behave as people expect.
Within these groups, some actions are more important than others. A “key action” is something you are ready to make decisions around: redesign a section, change a piece of copy, adjust onboarding, or shift budget between campaigns based on how often it happens.
If you’d like a deeper, more strategic take on how to design events, this event design primer breaks events into success, intent, and failure signals and shows how to use them as the backbone of your product analytics.
Categories of Events That Usually Pay Off
When you’re not sure where to start, focus on actions that:
- Move people deeper into your site or product (navigation).
- Show active interest, not just passive viewing (engagement).
- Bring someone closer to a result that matters to your business (conversion-like).
- Reveal pain points or broken flows (problems).
Even a small set of events across these four angles can completely change how you see your traffic.
Event Data Analytics: Turning Messy Clicks into Clear Insights
Once you begin collecting actions, you quickly end up with a lot of data. The challenge of analysing event-level information is that raw counts by themselves can be misleading.
Imagine you see 1,000 “add to cart” actions in a week. That number alone could mean:
- 1,000 different people each added a single item, or
- 100 people each added ten items, or
- a handful of loyal customers added and removed things over and over.
The same goes for generic actions like “form submitted”. Without context, you don’t know whether people were asking for support, booking a demo, downloading a resource, or complaining about something.
To make this data useful, it helps to look at actions through a few different lenses:
- By person
How many distinct users performed an action at least once? Do certain actions cluster among your best customers? - By visit
In which kinds of sessions does a specific action happen? Are people discovering it on their first visit or only when they come back? - By path or journey
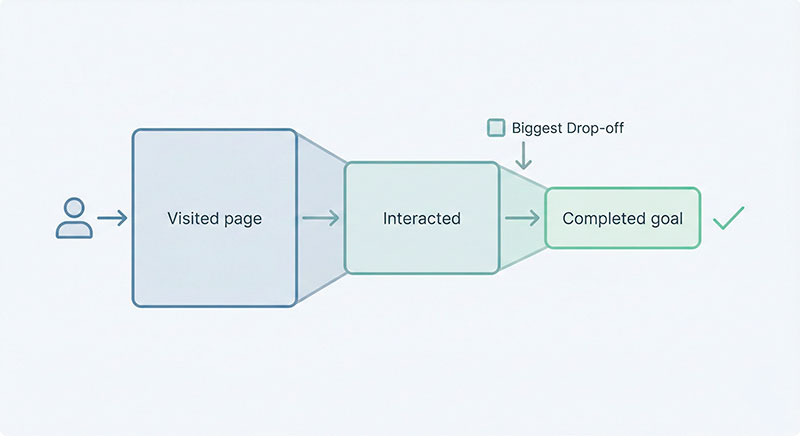
What usually happens before and after key actions? Which paths tend to end in success, and where do people commonly drop off?
This is where funnels and path analysis become powerful. For a step-by-step look at how funnels work in practice, this beginner-friendly guide to website funnel analysis explains how to map each stage, spot the biggest drop-offs, and prioritize fixes in your user journey.
From Raw Events to Questions You Can Actually Answer
If you want more concrete examples of event-based reporting in action, this event analytics overview collects common use cases and best practices for choosing the right events and turning them into actionable insights.
Instead of staring at big event tables, it’s more helpful to turn them into everyday questions, such as:
- At which step do people most often give up before a key action?
- Which common actions usually happen just before a purchase or signup?
- How do returning visitors behave differently from first-timers?
- Which journeys are typical for your happiest customers?
When you phrase things this way, event-level data stops being abstract and becomes a way to support the questions your team already has.
Event Analytics vs Traditional Web Analytics: How Your Mindset Changes
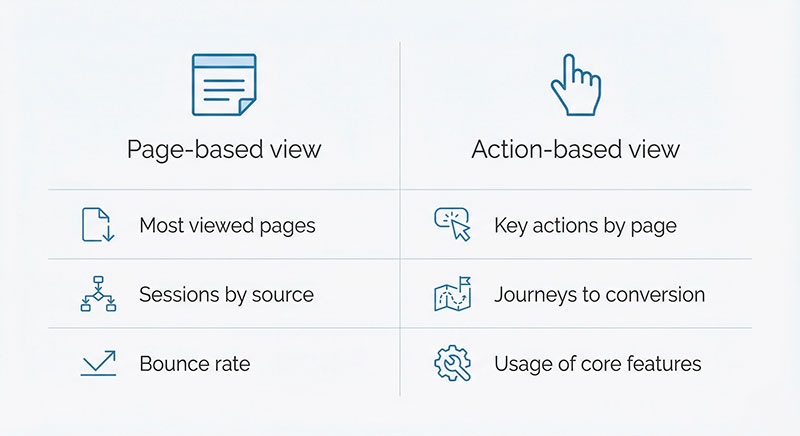
Traditional web analytics grew up around pages and visits. The core questions were: “How many people did we get?”, “Which pages are most popular?”, “Where did they come from?”. That view is still useful, but it misses the real texture of how people use your product or site.
An event-focused mindset shifts attention toward what people actually do:
- From “Which pages are getting views?”
→ to “Which actions line up with the results we care about?” - From “How many visits did we get?”
→ to “Which journeys lead people to important actions or outcomes?” - From “We have a lot of traffic”
→ to “We have visitors who explore, interact, and move toward value.”
Picture a marketer who loves reporting that a blog post brings in thousands of visits each week. On the surface, it sounds great. But once you connect that content to actions, you might discover that only a small portion of those visitors ever view your pricing, try a product demo, or join a mailing list. Suddenly, the goal is not just “more traffic” but “more of the right actions”.
Or imagine a product manager who sees steady sign-ups but poor retention. Looking at actions inside the product might reveal that many people never reach a key feature. That insight doesn’t come from page counts alone; it comes from observing the sequence of actions that users (don’t) take. To see how event-based thinking carries through an entire product lifecycle, this complete guide to product analytics for product teams shows how real companies use behavioral data to find friction, validate ideas, and shape their roadmap.
Thinking in Actions Instead of Pages
Back to the store analogy: it’s not enough to know how many people walked through the door. You want to know who browsed, who asked for recommendations, who tried something on, and who went straight to checkout.
On a website or inside a product, those moments are captured as actions. When you start thinking in those terms, your analytics stops being just a traffic counter and becomes a way to understand how real people move through your experience.
Event Marketing Analytics: Connecting Campaigns to On-Site User Behavior
Now let’s bring marketing into the picture. Campaign reports often fixate on clicks, impressions, and cost-per-click. Those numbers are useful, but they only tell you what happens before someone lands on your site. To understand whether a campaign truly works, you also want to see what people do after they arrive.
This is where connecting campaigns to on-site actions becomes powerful. Instead of judging a campaign only by click-through rate, you can see:
- How many visitors explore key pages like pricing or features.
- Whether they interact with core elements such as calculators, comparison tables, or demos.
- How often they start flows that look like the beginning of a sale, signup, or lead.
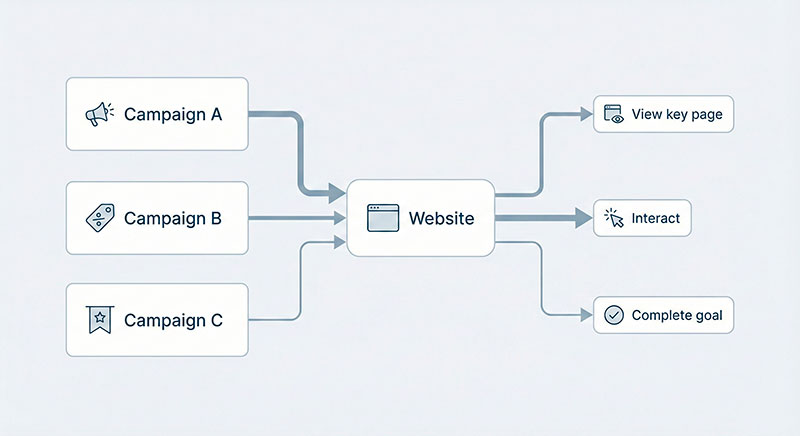
Imagine two ad campaigns with almost identical click-through rates. On paper, they look equally healthy. But once you connect them to actions on the site, you might find that:
- Campaign A leads to a lot of quick bounces and very few high-intent actions.
- Campaign B brings fewer clicks overall, but a much higher share of visitors who view pricing, start trials, or submit qualified forms.
In this case, the second campaign is far more valuable, even if the classic top-of-funnel metrics look modest.
The same logic applies to organic channels. Search or email might bring in less raw traffic than paid ads, but if those visitors consistently perform actions that correlate with revenue or long-term engagement, that channel deserves more attention. When you’re ready to connect campaigns to on-site actions, this guide to UTM best practices walks through how to tag links consistently so your event data stays clean and comparable across all channels.
From Campaign Clicks to Conversion Events
When you start viewing campaigns through the lens of actions, reports suddenly become more honest. Instead of celebrating clicks for their own sake, you can tell stories like:
- “People who click this ad usually land on a feature page, try the interactive tool, and then start a trial.”
- “Visitors from this newsletter tend to read deeply, download resources, and book calls with sales.”
- “This social campaign drives a lot of curiosity, but almost no one takes the next meaningful step.”
These stories are built from the sequence of actions people take, not just from how many times they opened a page.
Let Your Site Talk in Actions, Not Just Hits
Events are the language your site uses to tell you what visitors actually do, not just that they showed up. When you choose a small, meaningful set of actions to measure, your reports stop being a sea of numbers and start looking like a clear story about behavior.
You don’t need hundreds of different actions to get value. A focused mix of navigation, engagement, conversion-like, and problem events often reveals far more than another layer of traffic metrics.
Continue Learning
Explore more guides on tracking and analytics:
- How to add GA4 tracking code — get your basic setup right first
- How to check if GTM is working — verify your events are firing correctly
- Server-side tagging guide — the next level of tracking implementation
Bottom Line
A good way forward is to identify a short list of actions that truly matter for your business, give them clear names, and make sure they’re consistently captured. As your questions evolve and your product grows, you can refine and extend that list—but even a modest event set is enough to change how you see your users and the decisions you make from your data.
Meta description: Learn how to turn real user actions into meaningful analytics events, read cleaner reports, and connect marketing and product decisions to behavior.
Leave a Reply